1.nmid server内置prometheus监控服务,需要配置文件开启使用,默认metric数据为
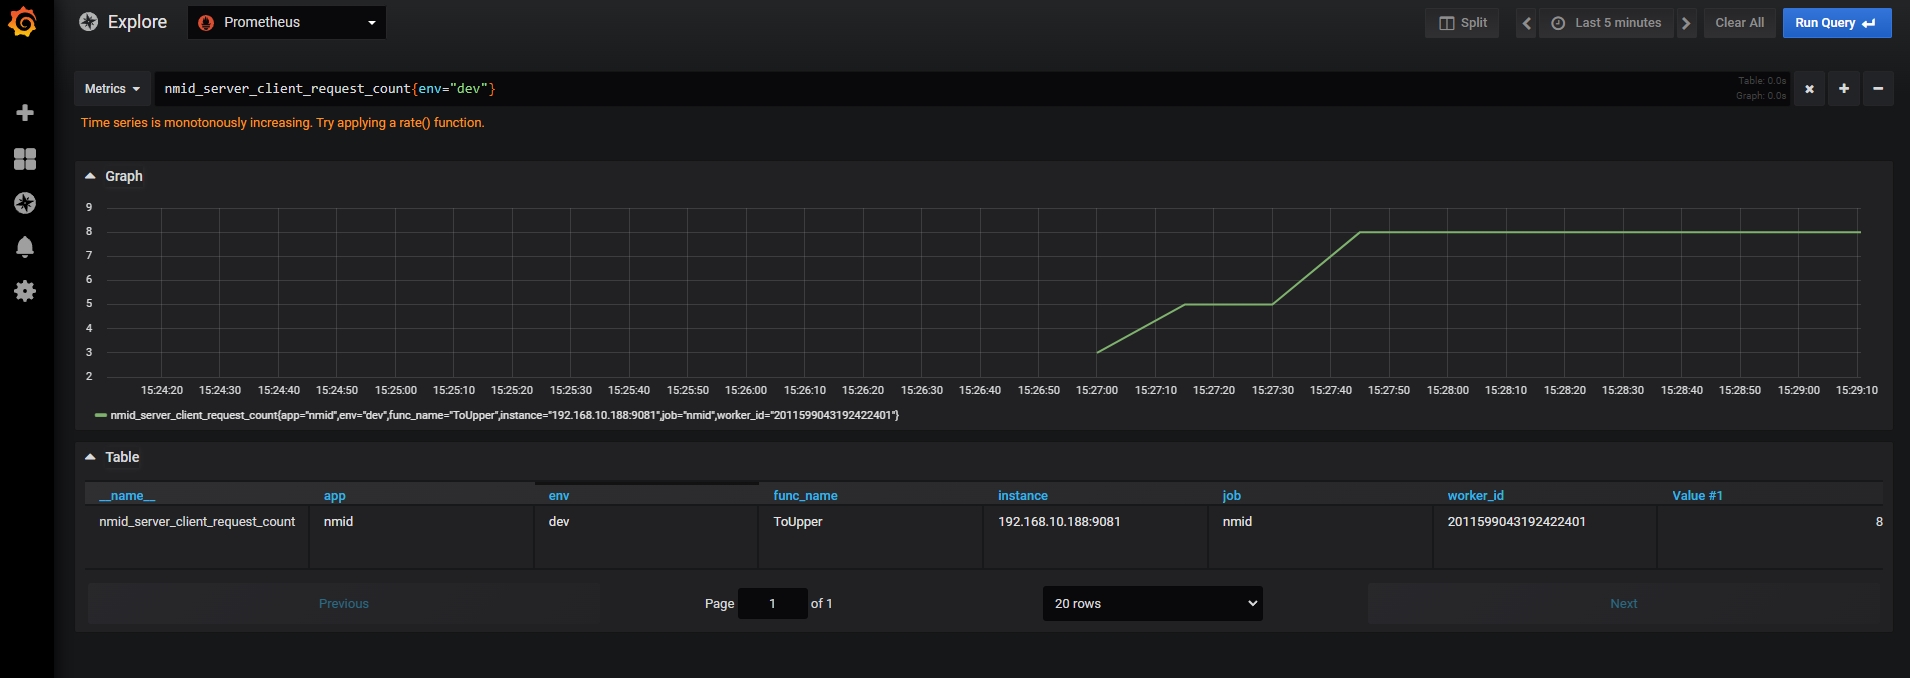
1️⃣nmid func调用次数(qps)
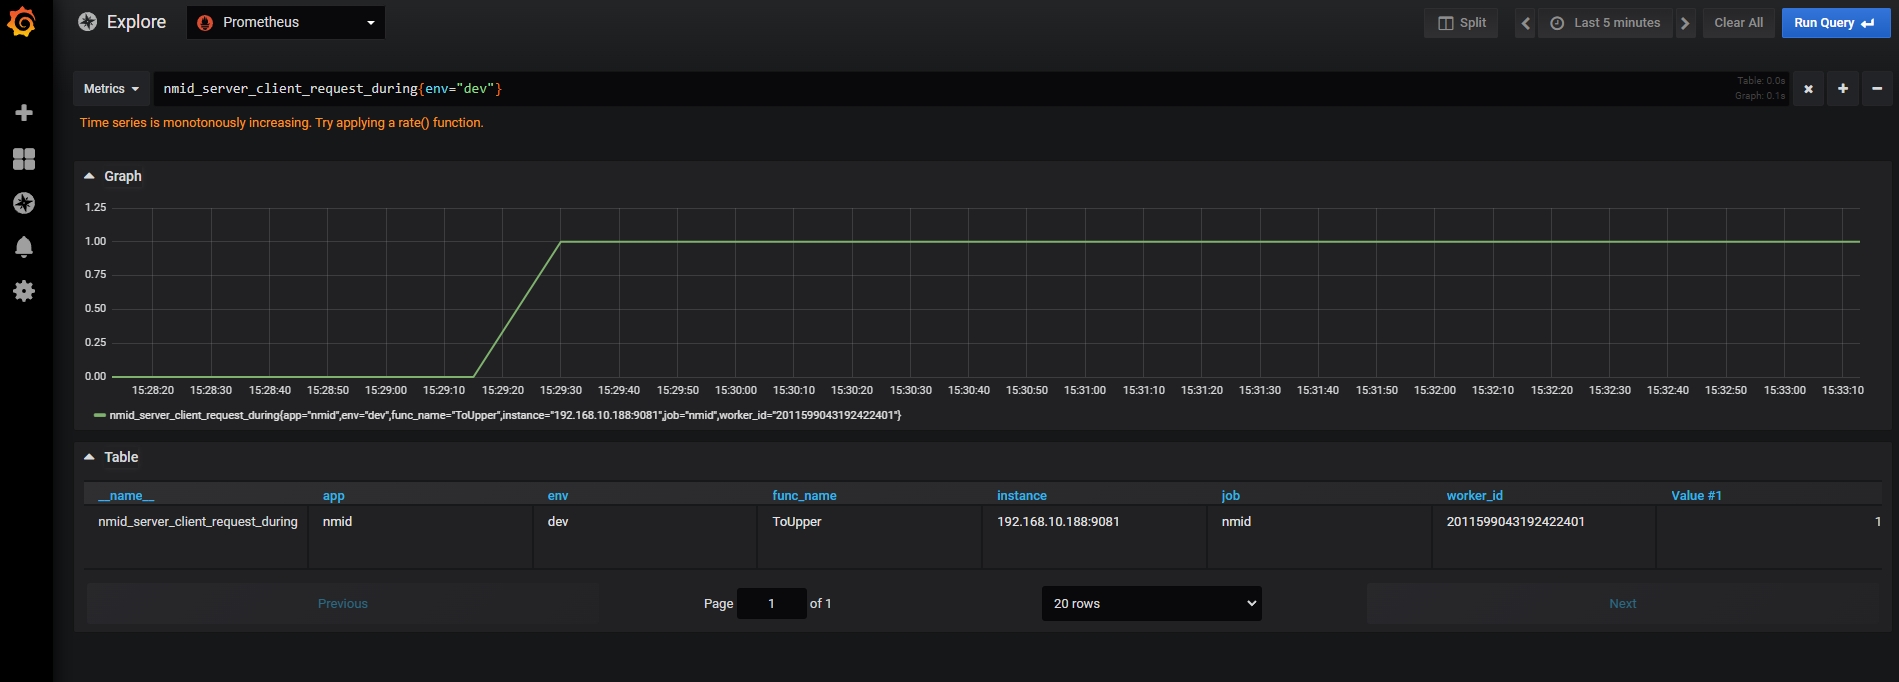
2️⃣nmid func调用耗时(during)
3️⃣func总数量
4️⃣每个worker中func数量
5️⃣func调用成功次数
6️⃣func调用失败次数
7️⃣worker关闭次数
2.同时可以使用nmid中已经封装好的prometheus pkg包对你自身服务进行各项prometheus metric监控
config
在配置文件夹中的server.yaml最后加入以下内容,当然配置参数根据自身情况进行修改
Prometheus:
  enable: true     #是否开启
  host: "0.0.0.0"
  port: "9081"
  path: "/metrics"
Grafana展示
nmid dashboard
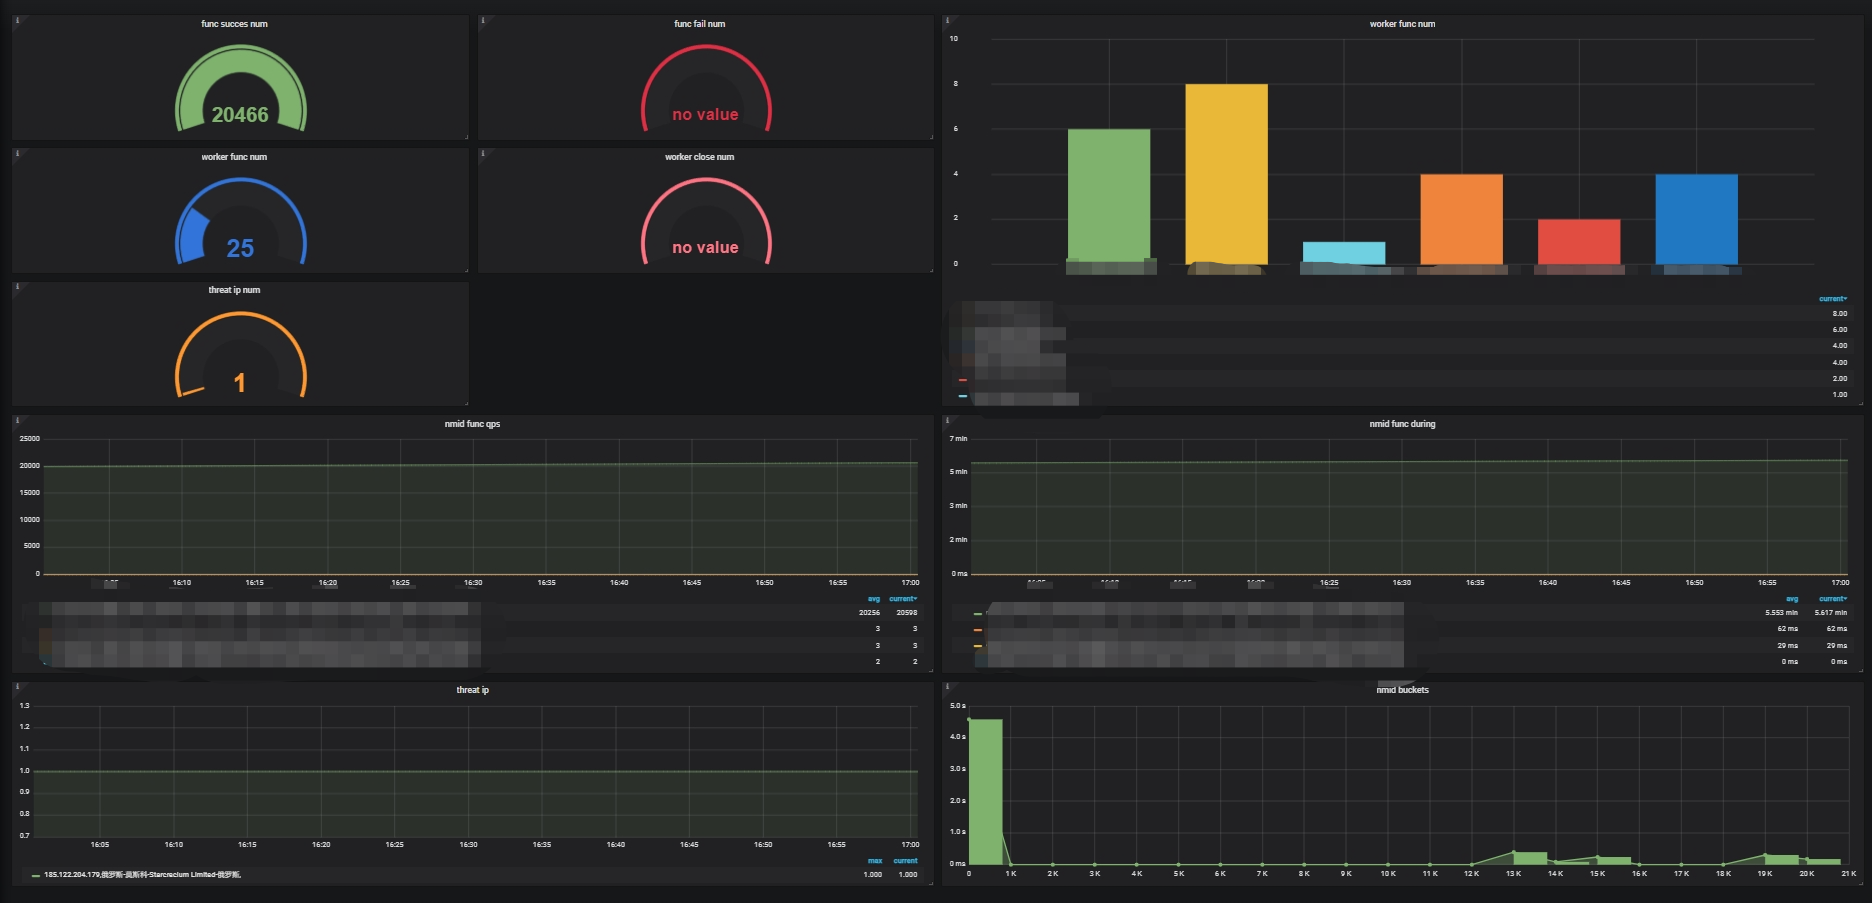
func qps
func during